by Miranda Bell-Tilcock, Jamie Sweeney, and Malte Willmes
Down the dark corridors of the Watershed Sciences building are freezers of dead fish. Frozen Chinook Salmon carcasses and their dissected eyes and muscles in neat vials are stacked next to White Sturgeon fin clips, Striped Bass scales, and tubes of stomach contents. This might sound like the stuff of horror movies, but these freezers are vital to understanding our native California fishes.
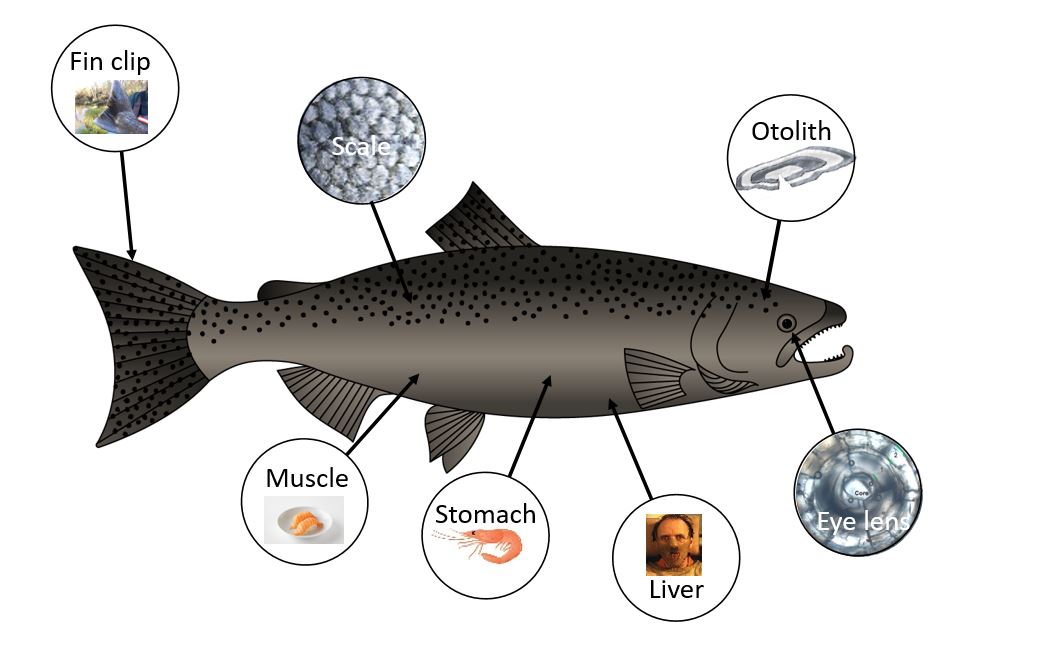
Each of these different fish parts tells a different part of its life history. Where and when each fish was born, which habitats it used to rear and grow, and what it ate. Studying these fish parts with a variety of scientific tools and methods allows researchers to reconstruct a more complete story of a fish’s life. Some fish parts can be collected from live fish, but sometimes a fish must be sacrificed to study it. In these cases researchers take care that no parts go to waste (Figure 1). Here we discuss how different fish parts are used to reconstruct the life histories of fish.
So let’s dig in and start with the tissues we can analyze non-lethally.
Fin clips – A small part of a fish fin is easy to collect, only minimally harms the fish, and yields heaps of genetic insights. For example, Chinook Salmon genetic information from fins provides accurate and rapid identification of run-type (winter, fall, late-fall, spring), for fish which otherwise look very similar. Fin clip genetics also helps researchers understand diversity within a population. This helps us know how healthy a population is, especially to aid in conservation of threatened or endangered species.
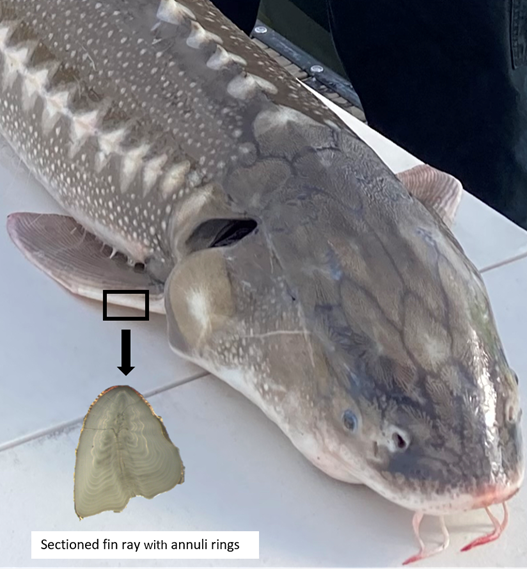
Fin rays – Calcified fin rays are a non-lethal tool to understand migratory patterns and life history for long-lived fishes such as White Sturgeon (Figure 2). White Sturgeon fin rays are composed of Calcium Phosphate and can begin recording trace elements from the surrounding environment as early as 20 days post-hatch. Information from fin rays allows researchers to understand movement between freshwater and ocean environments, with potential to detect environmental exposure throughout the fish’s life. In addition, fin rays also can be used to determine age and growth characteristics by examining the annuli rings in a sectioned fin ray.
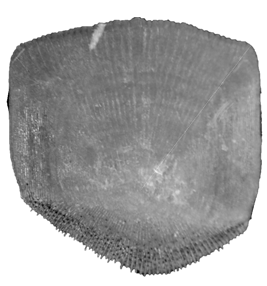
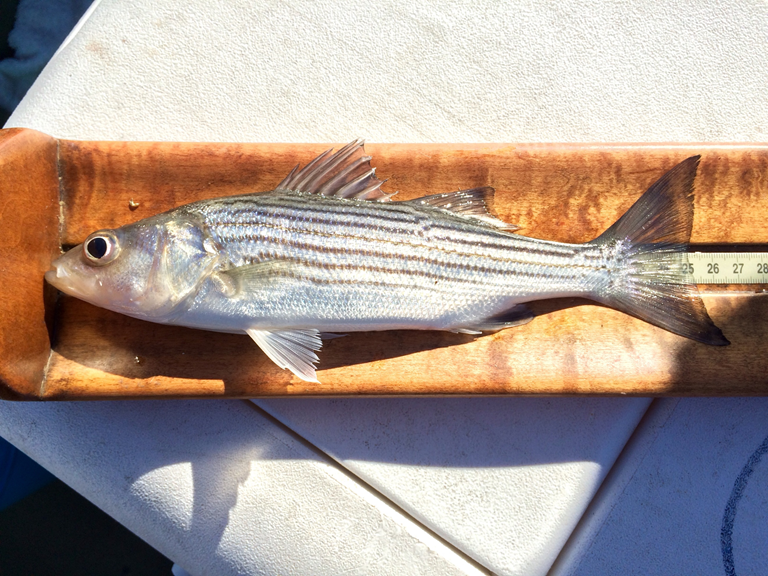
Scales – Fish scales also can be taken from living fish, as scales regenerate throughout their lives. Looking similar to a thumb print, fish scales can be used to determine fish age and growth. The dark banding on the scales mark annual lines, meaning the scale below came from a 4-year-old fish (Figure 3). As scales are often being regenerated, it’s important to choose the oldest ones, located near the lateral line either above or below depending on the fish.
While those parts of the fish are a non-lethal way to sample and learn about a species, taking a fish back to the lab to dismember (I mean dissect) can give researchers a more complete story.
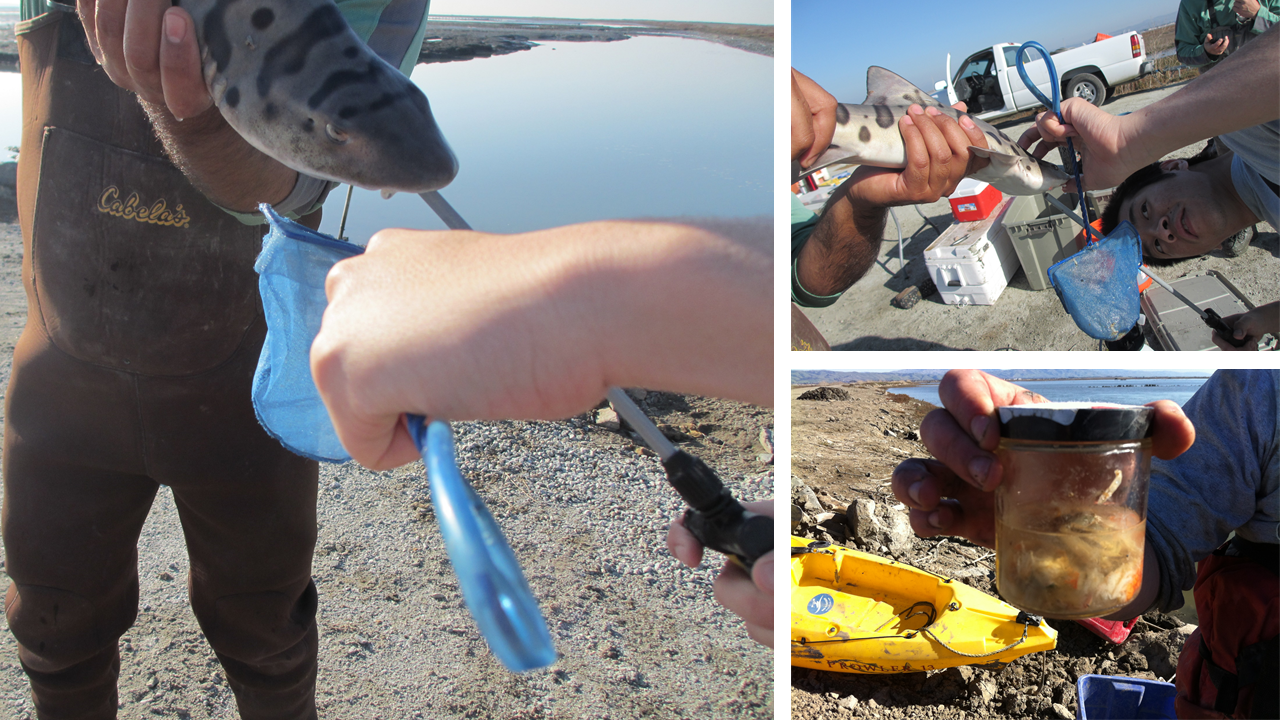
Stomach contents – Unfortunately, fish won’t tell us what they ate for lunch. For larger fish, such as Leopard Sharks (Figure 4) stomach contents can be extracted without injuring the fish. However, for smaller fish this doesn’t always work and sometimes lethal methods are required. Fish diet can tell us many things. For example, how full a fish is captured can indicate how healthy that particular environment is. To take it a step further, you can submit a fish’s stomach contents for isotope analysis.This produces a chemical fingerprint of fish consumption in the environment. If a fish is consuming a diet with a particularly unique isotopic value can be another way of understanding where a fish has been.
Liver – What if you’ve opened the fish and see nothing in its stomach (Figure 5). While this can indicate a poor environment, it also can mean the contents have been digested already. While taking out the fish liver can feel a little like playing Hannibal Lector, but like isotopes of stomach contents, liver isotopic values can indicate fish diet and movements. This way, even with an empty stomach, we can gain an idea of what and where a fish was consuming its food.
Muscle Tissue – The muscle tissue can provide a composite snapshot of what a fish consumed in the last 30-50 days. This is because a fish, especially as a juvenile, is constantly replacing its muscle tissue, integrating the isotopic value into that tissue. As with the previous tissues, this can help researchers understand where a fish has been rearing and its diet based on the isotopic values.
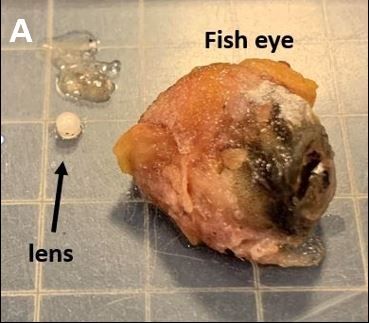
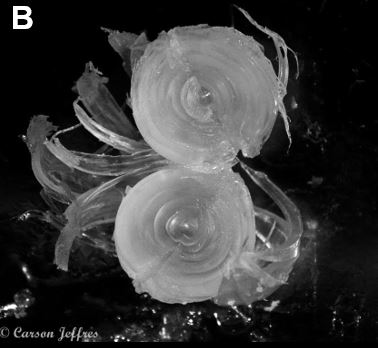
Eyes – Eyes are said to be the window to the soul, but in a fish’s case, their eyes are windows to their diet history. We don’t use the eye itself, but inside of the eye is a little pearl-like lens (Figure 6A) full of information. The lens is an onion shaped sphere, that starts with a core and with layers (or laminae) growing around it (Figure 6B). Each layer represents a different point in time in the fish’s life. Similar to muscle tissue, these layers are protein-rich and represent the isotopic values of food the fish ate. Researchers can use these layers to better understand what a fish consumed throughout their lifetime and potentially and where they ate throughout their lifetime.
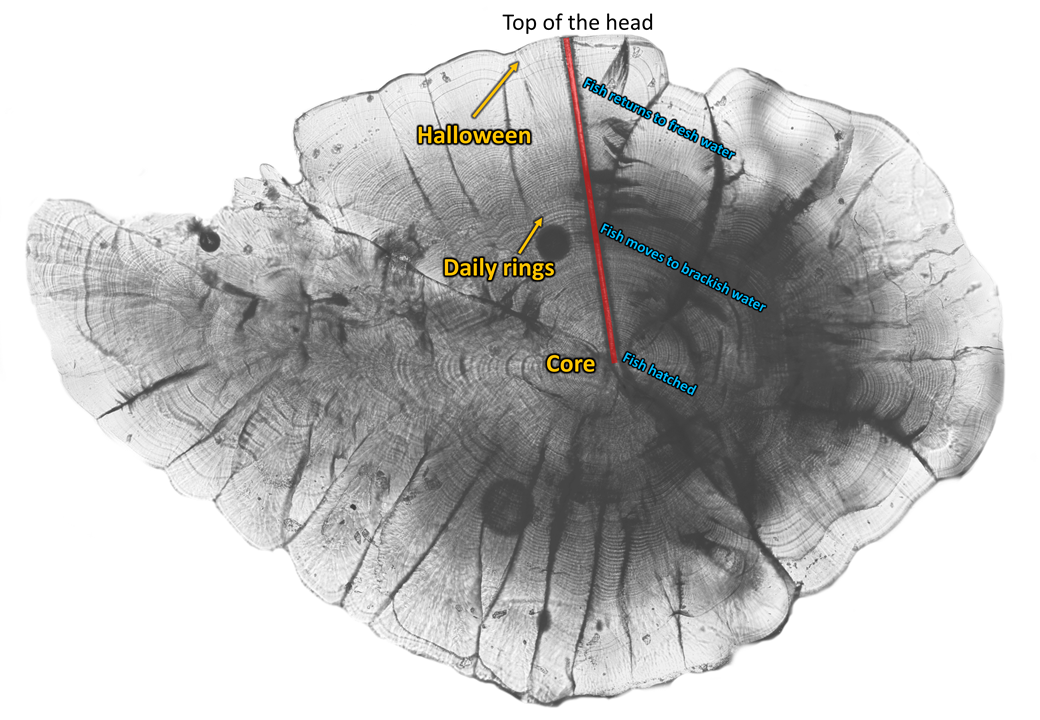
Otolith – These small calcium carbonate structures are also called “ear stones” and exist in the fish’s inner ear. Fish use these to detect sound, water pressure, and water depth. Otoliths form new daily layers throughout the fish’s life, similar to the annual rings found in trees (Figure 7). The sequence and width of these layers can help determine fish’s age and growth rates. Specific life events, like the start of feeding, or the movement from freshwater into the ocean, also leave distinct marks in the otolith. In addition, the otolith’s chemical composition can tell us about the habitat, diet, and temperature the fish experienced when the layer was formed. This means otoliths provide a time-resolved permanent archive of important fish life history events.
Implications
There are ongoing efforts to use a combination of fish tissues and analytical tools to better understand fish movement and what makes for good habitat. Many of these have been discussed on this blog (linked below). All of these parts, taken individually or together, can help tell a story to help inform researchers how to better conserve and keep fish populations resilient. So a freezer of dead fish helps their living relatives today and in the future!
Authors:
Miranda Bell-Tilcock is an assistant research specialist at the Center for Watershed Sciences, UC Davis.
Jamie Sweeney is a fisheries biologist at Cramer Fish Sciences and UC Davis Wildlife, Fish and Conservation Biology Alumni.
Malte Wilmes is a Postdoc at UC Santa Cruz in the Institute of Marine Sciences and NOAA Fisheries Collaborative Program.
Further reading (about using fish parts):
Wilmes, M. et al. “New insights into Putah Creek salmon,” California Waterblog. Oct. 18, 2020.
Stompe, D. “Striped Bass in the Pacific Ocean: When, where and why?,” California Waterblog. April 12, 2020.
Neal, K. and Saron. G. “Night of the Living Dead Salmon,” California Waterblog. Oct. 30, 2019.
Moyle, P. “Roaches of California: Hidden Biodiversity in a Native Minnow,” California Waterblog. Feb. 10, 2019.
Sturrock, A. and Phillis, C. “New paths to survival for endangered winter run Chinook salmon,” California Waterblog. Jan. 7, 2018.
Ogaz, M. “The Spawning Dead: Why Zombie Fish are the Anti-Apocalypse,” California Waterblog. Oct. 29, 2017.
Moyle, P., et al. “Understanding predation impacts on Delta native fishes,” California Waterblog. May 26, 2016.
Holmes, E. “Floods, farms, fowl, and fish: a confluence of successful management,” California Waterblog. March 20, 2016
Leave a Reply