by John Abatzoglou, Anna Rallings, Leigh Bernacchi, Joshua Viers, Josué Medellín-Azuara
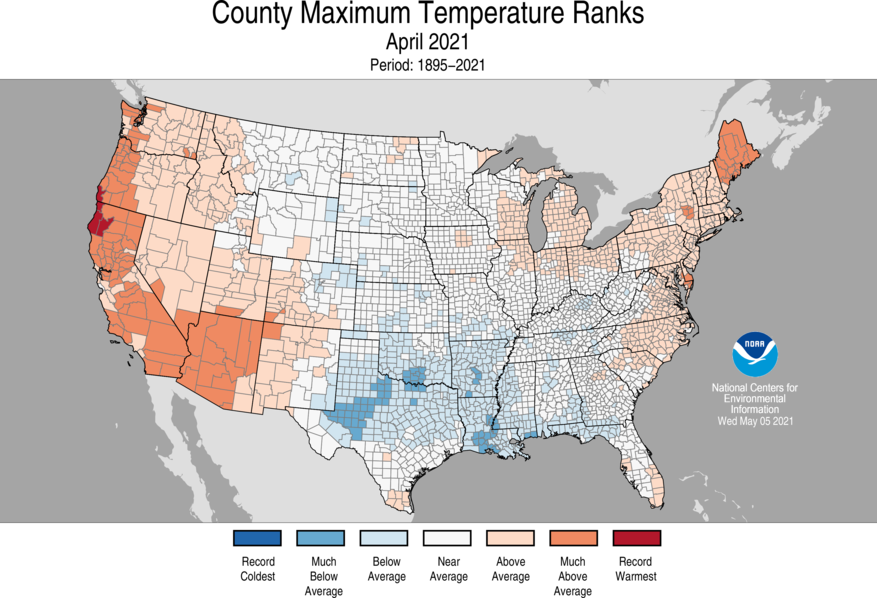
California’s 2021 water outlook became grimmer this spring as the state did not get fabulous February or miracle March precipitation. Unsurprisingly, spring streamflow forecasts from snowfed basins in the Sierra were far below average. For example, early April forecasts from California DWR called for April-July runoff to be between 59-70% of normal. Bad, but not terrible. Then came April, bringing little additional precipitation. To compound matters, April brought very warm temperatures for much of the state that led to rapid ablation (evaporation) of the Sierra snowpack. April began with snowpack around 60% of normal, but by month’s end was 20% of normal.
In early May a significant revision of forecasted spring flow estimated substantial reductions from forecasts of just one month earlier – in some cases a 28% reduction. Aggregated over the Sacramento River Basin, total forecasted flow for April-July dropped by 0.8-1.0 million-acre feet. This reduction in forecasted water supply turned a bad water year into a dreadful one with an amplified conundrum of long-standing water conflicts.
What led to such a drop-off in forecasts? Where did all that snow go if not into flow? While there is an official review of the procedures that led to the differences in forecasts underway, in this blog we look at five possible culprits.
Suspect #1: Lack of April Showers
April was dry. Much of the state had 10-25% of ‘normal’ April totals. April is never a drought buster, but the shortfall of April precipitation only worsened the developing drought. Aggregated over the Sierra Nevada, we estimate a shortfall of around 3” of precipitation in April 2021 that could otherwise contribute to streamflow, acknowledging that some of this became evapotranspiration. Certainly, some of the streamflow forecast revision could be from lack of rain, but unlikely enough to warrant such a large downgrade by itself.

Suspect #2: Sublimation of water from snow to the atmosphere
There has been speculation that high rates of sublimation in April facilitated the rapid ablation of snow – limiting how much of the snow became streamflow. Sublimation – direct loss of water from the snowpack to the atmosphere – can be an important fate for snowpack, particularly in locations with strong winds, very low dewpoint temperatures, snow in tree canopies, and where snowpack energetics limit melt. In practice, sublimation is challenging to track. To get a sense for how important sublimation generally is for snowpack ablation, we look at long-term data from the Variable Infiltration Capacity macroscale hydrology model. While these data suggest that sublimation can be quite high in the interior West, up to 40% in the semi-arid areas of the West including in the eastern Sierra, it is much lower in more maritime locations such as the Sierra western slope where sublimation is generally below 10%.

In April, dewpoint temperatures were 1℃ below 1991-2020 normal which would have hastened sublimation a bit, and wind speeds were not unusual. Given the rapid pace of snowpack ablation, it is unlikely that sublimation was the primary culprit behind the missing flow. More generally, hydrologic model simulations show that a warming climate generally reduces sublimation and increases infiltration.
Suspect 3: Evapotranspiration
Evaporation from melted snow at the surface and overall evapotranspiration is another likely factor reducing flow. There is strong evidence suggesting April 2021 reference evapotranspiration (Eto) was near record high values for much of the region. The combination of warm temperatures, unusually clear skies, and low dewpoint temperatures facilitated this increase in atmospheric thirst for the month. But this would only be about 1” more than average ETo for April.

Suspect 4: Dry antecedent conditions
Torrid dry conditions last year, depleted soil moisture through the summer of 2020, and an autumn with subpar precipitation had left soil moisture in the Sierra Nevada at near record low levels by April. Observations of soil saturation from the SNOTEL network show very low soil moisture throughout last winter and into early spring, with a distinct increase in late March and early April coincident with the drop in mountain snowpack.

<!– /* Font Definitions */ @font-face {font-family:”Cambria Math”; panose-1:2 4 5 3 5 4 6 3 2 4; mso-font-charset:1; mso-generic-font-family:roman; mso-font-pitch:variable; mso-font-signature:0 0 0 0 0 0;} /* Style Definitions */ p.MsoNormal, li.MsoNormal, div.MsoNormal {mso-style-unhide:no; mso-style-qformat:yes; mso-style-parent:””; margin:0in; margin-bottom:.0001pt; line-height:115%; mso-pagination:widow-orphan; font-size:11.0pt; font-family:”Arial”,sans-serif; mso-fareast-font-family:Arial; mso-ansi-language:EN;} .MsoChpDefault {mso-style-type:export-only; mso-default-props:yes; font-family:”Arial”,sans-serif; mso-ascii-font-family:Arial; mso-fareast-font-family:Arial; mso-hansi-font-family:Arial; mso-bidi-font-family:Arial; mso-ansi-language:EN;} .MsoPapDefault {mso-style-type:export-only; line-height:115%;} @page WordSection1 {size:8.5in 11.0in; margin:1.0in 1.0in 1.0in 1.0in; mso-header-margin:.5in; mso-footer-margin:.5in; mso-paper-source:0;} div.WordSection1 {page:WordSection1;} –>
Figure D: Soil saturation data at 8” depth for the Echo Peak SNOTEL station. The black line shows that soils were parched through mid-March when snowmelt commenced. Data source: NRCS.
Likewise, hydrologic models depict a similar fate of soil moisture being very dry throughout much of the winter. This suggests some portion of snowmelt was taken up in soil moisture given the far-from-saturated state of the soils when the 2021 water year began.
Suspect 5: Snow Water Equivalent was overestimated
The 60% snow water equivalent (SWE) numbers on April 1st came from DWR-based snow stations. Measuring snow over large areas is challenging and even a well-designed operational network might not adequately capture the distribution of snow across complex terrain. So perhaps the snow water volume in the Sierra was less than 60% of long-term average.
The single notable atmospheric river to hit California in 2021 in late January, bringing exceptional precipitation and snowfall to parts of central California and the Central Sierra. Given that it occurred at climatologically the coldest time of the year, it dropped heavy – in some cases record – snowfall in lower elevation mountains. For example, Calaveras Big Tree State Park (4800’ elevation) saw 76.5” of snow, over ¾ of their total for 2021 during this event. For this site, the 3-day snowfall total was the highest in the observational record. This provided a huge bump for snow at lower elevations but left higher elevations in a sizable deficit that expanded thereafter.
Colleagues, including Dan McEvoy, from the Desert Research Institute have been tracking snow droughts (less than usual accumulations of snow). Reductions in mountain snowpack have been sizable in recent years and are expected to increase in the coming decades. The ratio of SWE and cumulative precipitation since Oct 1st shown in the plot below, effectively tracks snow water storage efficiency. Curiously, for a snapshot of these data in late February all sites with SWE values above 85% of median SWE were at lower elevations (<7500’), despite seeing well below normal precipitation. Increased aerial surveying of snow, such as from Airborne Snow Observatories, may improve estimates of SWE beyond those with traditional snow survey and automated snow sensors.

So, whodunit?
In a classic whodunit, five suspects are in the line-up for the case of the missing flow.
Lackluster April precipitation certainly contributed to the downward revisions in forecasted flow. In addition, the prime suspects of parched soils from 2020 and dry atmospheric conditions, acted together to steal snow from their typical streams. Michael Dettinger finds similar shortfalls in streamflow relative to precipitation since fall of 2019 across California and Nevada. Tessa Maurer and colleagues exploring catchment level feedbacks between ET and subsurface storage found that nonlinearities in the water balance can decouple precipitation and runoff during droughts. They also identify several confounding factors that may limit our understanding of hydrological feedbacks, including the loss of high-elevation runoff, often considered a drought mitigator, from temperature fueled increases in ET at high elevations or lateral redistribution of precipitation excess from higher elevations to unsaturated soil at lower elevations.
Suspects we can manage through forecasting
While we have focused on identifying the prime suspects for the missing streamflow, such scientific detective work may ultimately help improve forecasting accuracy and early seasonal warning systems for managing water. We highlight two fronts to improve forecasts.
First, modeling studies are showing that old rules of thumb are becoming less reliable for anticipating water resources in a changing climate and demand significant updates. Improved understanding of mountain processes that involve snow, soil, and vegetation may help improve forecasts. Previous studies show substantial changes in how water years play out with climate change in California – including more frequent dry and critically dry water years. Back-to-back snow droughts – like we experienced in 2020 and 2021 – are projected to become increasingly likely in the Sierra Nevada with continued warming. Likewise, we expect new types of water years that we have not seen in modern times that will challenge operational water forecasting and allocation decisions. More critical calculations will support better understanding to improve forecasts, allocations, and flexible management.
Second, incremental advances in sub-seasonal to seasonal climate forecasts have potential to inform water forecast and allocation decisions. For example, April forecasts issued in mid-March called for very dry and warm conditions for the state. Incorporation of such climate forecasts into water allocation forecasts may aid decision-making.
Further Reading
Abatzoglou, J. T., McEvoy, D. J. & Redmond, K. T. (2017) The West Wide Drought Tracker: Drought Monitoring at Fine Spatial Scales. Bull. Am. Meteorol. Soc. 98, 1815–1820
He, M., Anderson, J., Lynn, E., Arnold, W. (2021) Projected Changes in Water Year Types and Hydrological Drought in California’s Central Valley in the 21st Century. Climate, 9, 26.
Huntington, J. L., Hegewisch, K. C., Daudert, B., Morton, C. G., Abatzoglou, J. T., McEvoy, D. J., & Erickson, T. (2017). Climate Engine: Cloud Computing and Visualization of Climate and Remote Sensing Data for Advanced Natural Resource Monitoring and Process Understanding, Bulletin of the American Meteorological Society, 98(11), 2397-2410.
Livneh, B., Badger, A.M. (2020). Drought less predictable under declining future snowpack. Nat. Clim. Chang. 10, 452–458
Marshall, A. M., Abatzoglou, J. T., Link, T. E. & Tennant, C. J. (2019). Projected Changes in Interannual Variability of Peak Snowpack Amount and Timing in the Western United States. Geophys. Res. Lett. 46, 8882–8892
Maurer, T., Avanzi, F., Glaser, S. D., and Bales, R. C.: Drivers of drought-induced shifts in the water balance through a Budyko approach, Hydrol. Earth Syst. Sci. Discuss. in review, 2021.
Null, S. E., & Viers, J. H. (2013). In bad waters: Water year classification in nonstationary climates. Water Resources Research, 49(2), 1137–1148.
Williams, A. P. Williams, A.P., Cook, E.R., Smerdon, J.E., Cook, B.I., Abatzoglou, J.T., Bolles, K., Baek, S.H., Badger, A.M. and Livneh, B. (2020). Large contribution from anthropogenic warming to an emerging North American megadrought. Science 368, 314 LP – 318
John Abatzoglou is an associate professor in the Management of Complex Systems Department at UC Merced. Anna Rallings in a staff scientist and lab manager of the VICElab at UC Merced. Leigh Bernacchi is the program director of the Center for Information Technology Research in the Interest of Society and the Banatao Institute at UC Merced. Josué Medellín-Azuara is the associate director at the UC Davis Center for Watershed Sciences and an associate professor at the Department of Civil and Environmental Engineering at UC Merced. Joshua Viers is Campus Director of the Center for Information Technology Research in the Interest of Society and the Banatao Institute, Associate Dean for Research, School of Engineering at UC Merced and professor in the Department of Civil and Environmental Engineering at UC Merced.
Leave a Reply