By Ryan Miller and Nicholas Pinter
Following a major flood or other natural disaster, the US federal government provides disaster assistance to individuals and local and state jurisdictions to help them recover. Over the past ~20 years, these federal payments have totaled nearly $150 billion (in 2020 dollars), including over $20 billion for recovery from Hurricane Katrina and $15 billion from Hurricane Sandy. We analyzed 20 years of federal data to assess patterns of FEMA disaster assistance, focusing on aid to California, peer states, and FEMA assistance across the US.
A principle conclusion is that California has received less federal disaster assistance on a per-capita basis than most peer states and less than United States averages for all disaster types. The imbalance is especially pronounced for flood-related events, and reinforces previous findings that California has relied less on federal flood funding, including National Flood Insurance Policy claims, than most states over the past 20-30 years. In addition, delay times in receiving FEMA Public Assistance funds showed wide variations, with delays ranging from a few days up to almost 16 years.
Data
We analyzed 20 years of information about three types of assistance from the Federal Emergency Management Agency (FEMA), including: Public Assistance (PA) to repair public infrastructure, Individual Assistance (IA) provided to individual victims of disasters, and Hazard Mitigation Assistance (HMA) spent to reduce future losses. FEMA also underwrites flood insurance payments from the National Flood Insurance Program (NFIP), a type of post-disaster funding analyzed separately (see Pinter, N., R. Hui, K. Schaefer, and D. Conrad, Dec. 14, 2016. California, Flood Risk, and the National Flood Insurance Program. California Water Blog: https://californiawaterblog.com/2016/12/14/california-flood-risk-and-the-national-flood-insurance-program/.) In addition, other federal agencies and programs, for example the Small Business Administration, also sometimes invest in post-disaster recovery.
Patterns in Disaster Aid
Public Assistance (PA) payments nationwide (Figure 1a) vary each year, but show increasing numbers of “Billion Dollar Disasters” in recent years (NOAA, 2022; https://www.ncei.noaa.gov/access/billions/). Most PA payouts nationwide (66.1%) were for hurricanes, with peaks in 2006 (after Hurricane Katrina) and 2018 (after Harvey). Non-hurricane flooding is the second-largest category of PA funding (20.4%), followed by fires (8.6%; reconstruction in the wake of the September 11 Terror Attacks were coded as ‘Fire’, explaining the spike in in 2002-2003). Payouts for all other disaster types represented less than five percent of the total.


PA allocations to California (Figure 1b) differ from the national pattern. Most PA projects in California in recent years have been for fire, with the largest expenditures in 2018, following the Tubbs, Carr, and Camp fires. In other years, total PA spending in California was in the low tens of millions of dollars.
California also draws far less in PA funds per capita than most other U.S. states – particularly for flooding (Table 1; Figure 2). A handful of small Mountain West and Midwestern states received over $1,000 per capita in PA during 2000-2019, while several states received less than $10 per capita. The average per-capita PA expenditure nationwide was over $251, more than 23x higher than $10.90 per-capita in California.

The simplest explanation for state-to-state differences in federal disaster relief allocations is that disasters are rare and somewhat random, and that 20 years might not do justice to long-term disaster occurrence. However, the data (e.g., Figure 3) hint at political factors at work. The five most populous states – California, Texas, New York, Florida, and Pennsylvania — each received less than $50 per capita in PA during 2000-2019, compared to over $250 per capita nationwide. Other states such as Idaho, Wyoming, and New Hampshire received over $1,000 per capita over the same period. Perhaps influential politicians from small states steer PA funding to the less populous states they serve.


Patterns in California
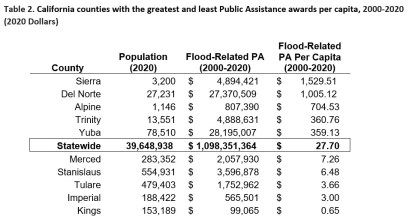
In California, the counties receiving the most Public Assistance per capita (Table 2; Figure 4) were predominantly small and rural and mostly in Northern California, while those receiving the least PA per capita were all in the San Joaquin Valley.

Payment Times
FEMA’s PA database includes the date that federal funds were obligated to local jurisdictions and the date funds were fully received (Table 3-4). Lag times varied from just 2-3 days for some projects up to 5,800 days (almost 16 years). Average PA payment times in California are about the same as elsewhere in the US, for both flood and non-flood related disaster declarations. California had a greater share of moderate delays than elsewhere in the country: nearly 40% of the funds disbursed in California had payment delays of 1-2 years, compared to 22% nationwide (Figure 6). Conversely, California had fewer extreme delays, with less than 1% of lag times >3 years, comparing to nearly 20% nationwide.


Over the past 20 years, the time to process PA funding has increased (Figure 5). Larger states have longer delays than small states. Puerto Rico and Louisiana had the longest delays, probably from the complicated assistance projects following Hurricanes Maria and Katrina.


Conclusions
The imbalance between what California has received over the past 20 years from FEMA disaster assistance programs relative to other states mirrors imbalances documented in California’s claims from the National Flood Insurance Program (Pinter et al., 2016). The results here raise the same question as raised in discussions of California’s role in the NFIP – whether California “has just been lucky” (avoided major floods in the last 21 years), or rather “has flood risk … been overestimated or successfully managed or reduced” (Pinter et al., 2016). The analyses here – which normalize FEMA disaster payments to population as well as independent measures of flood exposure – suggest California has indeed managed its flood risk better than other areas of the US. We encourage California policymakers and flood managers to continue investing in floodplain management and flood-risk reduction.
Ryan Miller is a PhD Candidate in the Geography Graduate Group at the University of California, Davis. Nicholas Pinter is the Shlemon Chair in Applied Geosciences in the Department of Earth and Planetary Sciences at UC Davis and is Associate Director, Center for Watershed Sciences.
Leave a Reply